Marius Andersen
Deputy, EFTA Statistical Office
This article presents empirical evidence of “excess mortality” — this means the numbers of deaths exceeding the expected numbers of deaths in a given time period — in Germany, Italy, Norway, Sweden and Switzerland during the first wave of the COVID-19 pandemic, roughly defined as February to July 2020. The final section presents regional disparities of excess deaths based on population density data for all European countries.
This article addresses these questions while focusing on selected European countries. The analysis is based on weekly mortality data provided by Eurostat’s dissemination database and additional data from the German Statistical Office, Destatis.[2] Weekly mortality figures for 2020 will be compared to an average of weekly mortality for the years 2016 – 2019.[3]
The investigation will start with a general comparison of mortality rates for the larger EFTA countries, i.e. Norway and Switzerland[4], contrasted by respective data for Italy as one of the more severely impacted EU countries, which was also amongst the first to decide on a national lockdown as a countering measure. Subsequently, comparisons with figures for Germany, as an EU country with a more moderate course of mortality rates, and Sweden, as an EU country with an accented liberal approach in handling the epidemic, will be presented.
Besides showing the general picture for the selected countries, the first three sections will also highlight how excess mortality — most probably due to COVID-19 — correlates in these countries with socio-demographic factors like sex or age. The last section will take a look at how population density correlates with excess mortality in a large selection of European regions.[5]
Excess mortality: The overall picture
Figure 1 illustrates the weekly excess mortality among the general population of Germany, Italy, Norway, Sweden and Switzerland from early February to the end of July 2020, measured against average weekly mortality during 2016 – 2019. Italy in particular stands out with high mortality during March, April and May. The other four countries also had a peak in excess mortality in April, but the peak was much more pronounced for Sweden and Switzerland than for Germany and in particular Norway.
During this first wave of the pandemic, Germany, Italy, Norway and Switzerland all introduced lockdown measures in one form or another. The point in time when the lockdown was introduced nationally is illustrated by the vertical lines in Figure 1. For all four countries, excess mortality peaked about two weeks after the introduction of the lockdown, after which it decreased towards more “normal” levels. Italy peaked at 84.9 percent above the average of the preceding four years and remained at a comparatively high level (5 percent or more above the average) for eight weeks. Switzerland peaked at 44.0 percent with excess mortality remaining high for four weeks. Peak excess mortality in Germany and Norway was much lower, at 14.1 and 9.9 percent, and remained elevated during the next four weeks.
Sweden is an interesting case because the country never introduced a formal lockdown. Excess mortality peaked at 49.2 percent and remained high for 12 weeks, i.e. longer than in Italy, which had much higher excess mortality. Looking at the figures for Sweden in comparison to especially Italy and Switzerland, it seems that the lockdown in the latter two countries did have a major impact, both as concerns the level of excess mortality and the duration of the recovery period. Germany and Norway had much lower excess mortality in the first place, but the introduction of lockdown measures clearly contributed to bringing mortality down and in particular to shorten the recovery period in these two countries as well.
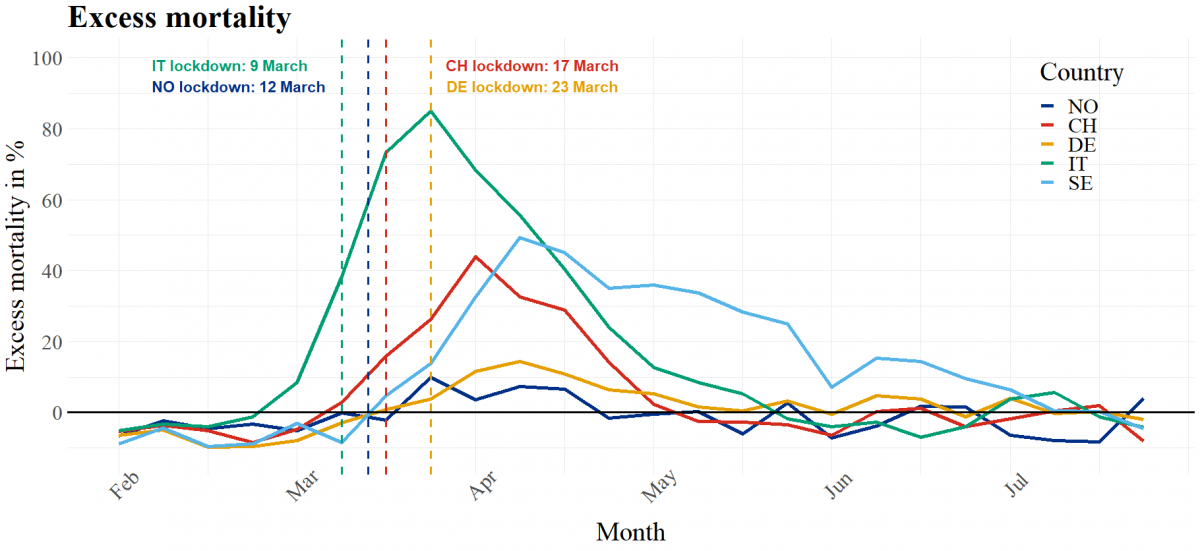
Figure 1: Excess mortality. Percentage differences between 2020 weekly mortality and average weekly mortality from 2016 – 2019. The month labels indicate the start of every month. The x-axis indicates the average mortality 2016 – 2019.
Source: Eurostat (demo_r_mweek3)
Excess mortality: Mortality by sex
Several studies have pointed out the fact that worldwide, men are more likely to die due to infectious diseases than women.[6] The same tendency seems to hold also in the case of the COVID-19 pandemic, as the inspection of the weekly data on excess mortality for our selected European countries shows (see Figure 2). The tendency of men displaying somewhat higher excess mortality than women for Italy, Sweden and Switzerland is especially pronounced during the peak of the first wave. Interestingly and contrary to this general diagnostic, the out-phasing part of the excess mortality curves for Italy show somewhat higher excess mortality for women than for men in the period April to June 2020 which might reflect underlying differences in population shares of women as compared to men.
Although the graphs for Norway and Germany show comparably weak amplitudes for the first wave, the trend for males exceeding excess deaths of females is also visible here, with Germany showing two lower peaks in excess deaths for females exceeding the numbers for males in June and July 2020.
Sweden, as a country that abstained from imposing a lockdown during the first wave, displayed a peak of excess deaths similar in magnitude to Switzerland with values of around 40 percent (females) and 60 percent (males) excess deaths above the average of 2016 – 2019. However, the phasing-out period of the excess deaths peak in Sweden remained clearly at a higher level and for a longer time than in Switzerland. The same holds for the comparison between Sweden and Italy: Even though the peak in Italy was much higher than in Sweden, the lockdown in Italy seemed to have brought down excess deaths significantly faster than in Sweden.
One might argue that the population or regional differences in countries like Germany, Italy and Switzerland on the one hand and Scandinavian countries like Norway and Sweden on the other hand do not allow us to draw conclusions on how a lockdown affects excess deaths. A simple look at the respective figures for Norway and Sweden as two countries that are fairly comparable as regards population size and regions reveals the highly significant differences in excess mortality that might well be attributed to the lockdown measures introduced in Norway.
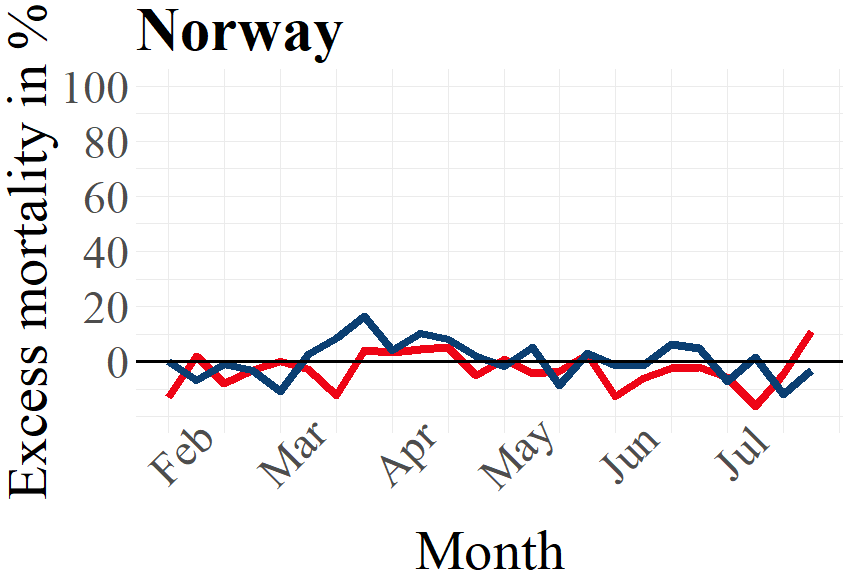
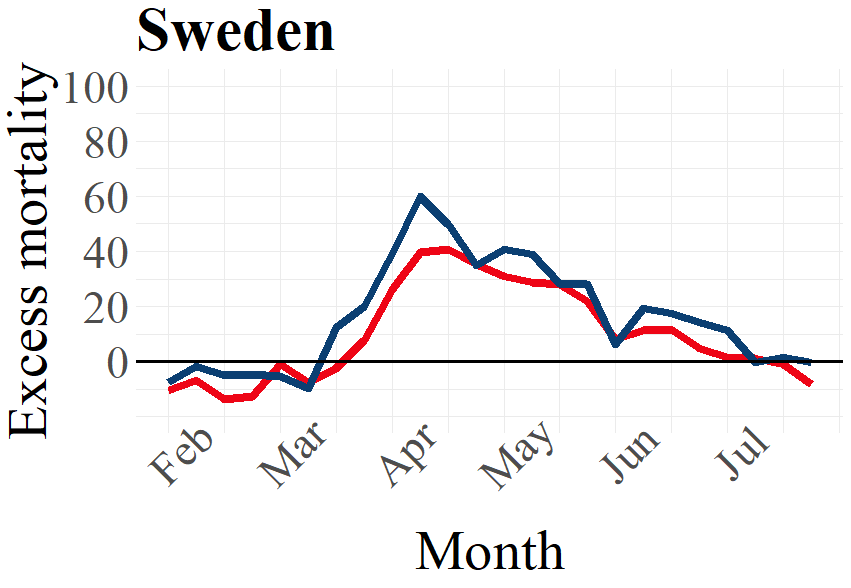
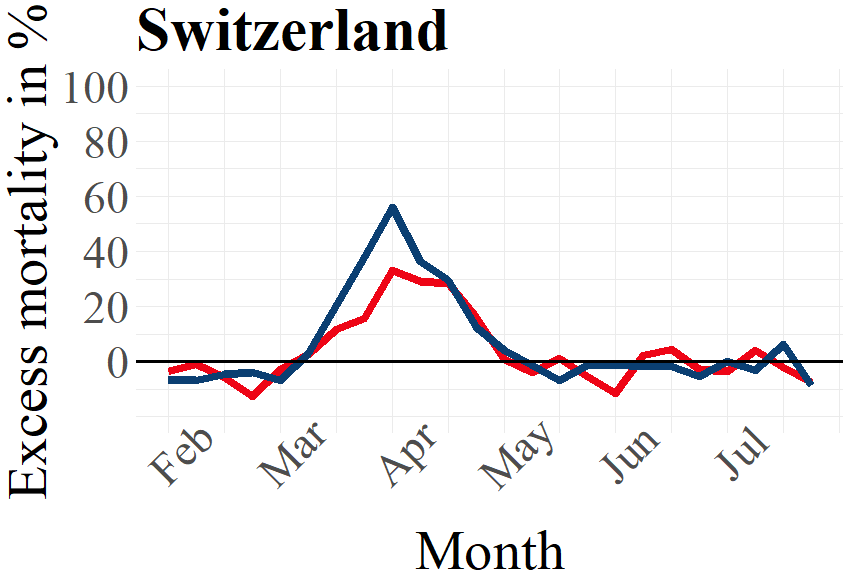

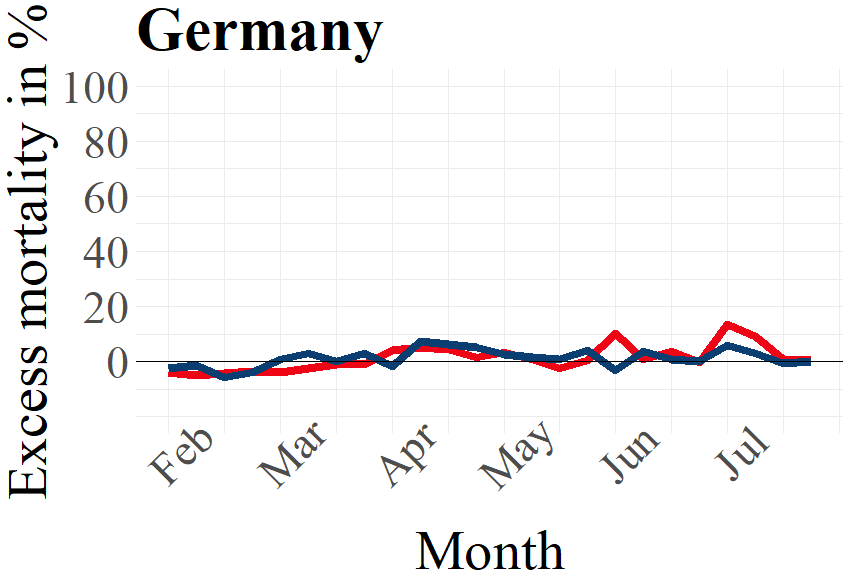
Figure 2: Male and female excess deaths in percent 2020 by country. The x-axes indicate the average mortality 2016 – 2019.
Source: Eurostat (demo_r_mweek3) and Destatis (D_2016_2020_KW_AG)
Excess mortality: Mortality by age
There are, as expected and shown in Figure 2, clear differences in excess mortality between males and females. Another expectation based on empirical evidence is that people in higher age groups are more likely to die due to COVID-19 infections.[7] Given this, we expect higher levels of excess mortality for higher age groups than for the lower age groups. This is indeed what we find for all countries considered in Figure 3, except for Norway.
The population pyramids below display, for each country, the excess deaths for different age groups in the peak phase of the first wave of the pandemic. For calculating the absolute numbers of excess deaths in every week, we compare the numbers during the peak phase to the average number of deaths during the same week in 2016 – 2019. Excess deaths are any number of deaths in the peak phase that exceeds the respective four-year average. The peak phase of the first wave occurred during different periods in the countries we consider. We therefore use data from different weeks depending on when each country experienced a relatively high level of excess mortality. We focus on this peak phase of the first wave for each country in order to evaluate how the level of excess deaths in the most severe part of the pandemic varies for different age groups.
To indicate how the numbers of excess deaths varies for different age groups during the peak phase of the first wave in the selected countries, the population pyramids below also display the differences for each sex in every age group. We see, as expected and established earlier in this publication, that for most age groups, males have a higher excess death rate than females. Note that due to there typically being a higher number of females in the highest age groups, females in these age groups tend to display higher numbers than males in the same age groups. However, Figure 2 reveals that the rate of excess deaths are generally higher for males. This means that a man who is part of the highest age groups is more likely to die during the peak phase of the pandemic than a woman in that age group.
As becomes evident from a look at Figure 3, the highest age groups have the most elevated numbers of excess deaths during the first wave of the pandemic. For those younger than 60 years old, or even 70 years old in Norway and Switzerland, the number of excess deaths are rather low or inexistent. For the age groups higher than this, excess deaths are substantive in nearly all countries. Norway is the exception to this, as even the highest age groups did not consistently experience excess deaths during the peak phase of the first wave. This is in line with the earlier made observation that Norway had relatively low levels of excess mortality during the first wave of the pandemic. Contrary to Norway, all other countries experienced excess deaths in all higher age groups for both males and females, although the excess deaths for the higher age groups in Germany were not as pronounced as for the other countries.
To summarise, the well-known tendency that highest age groups show higher excess deaths than lower age groups can also be confirmed for the selected countries. To be clear, whether COVID-19 directly causes these excess deaths remains an open question. However, as we consider excess deaths exclusively during the peak phase of the first wave of the pandemic, this correlation-based assumption seems plausible.
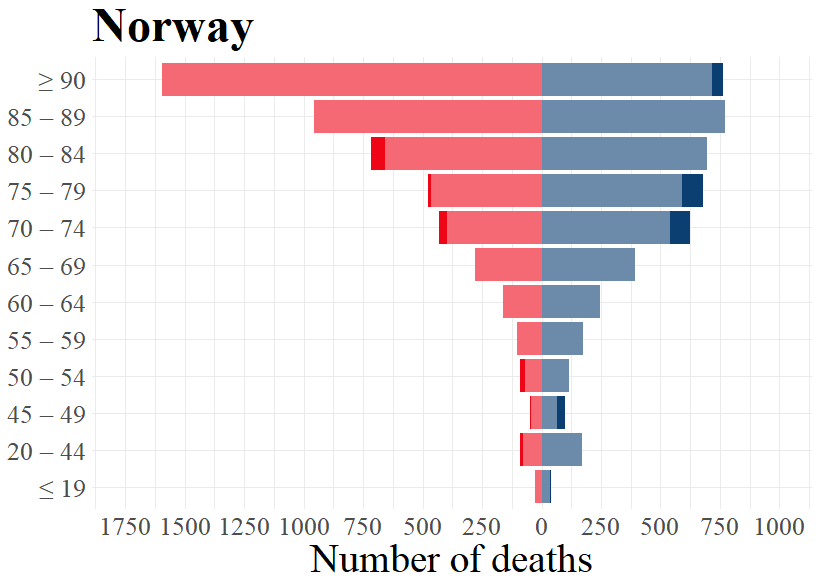
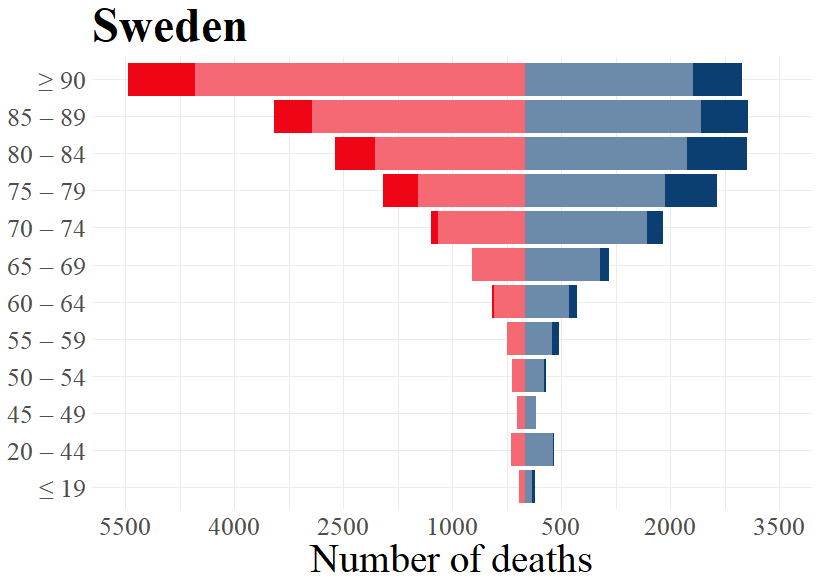
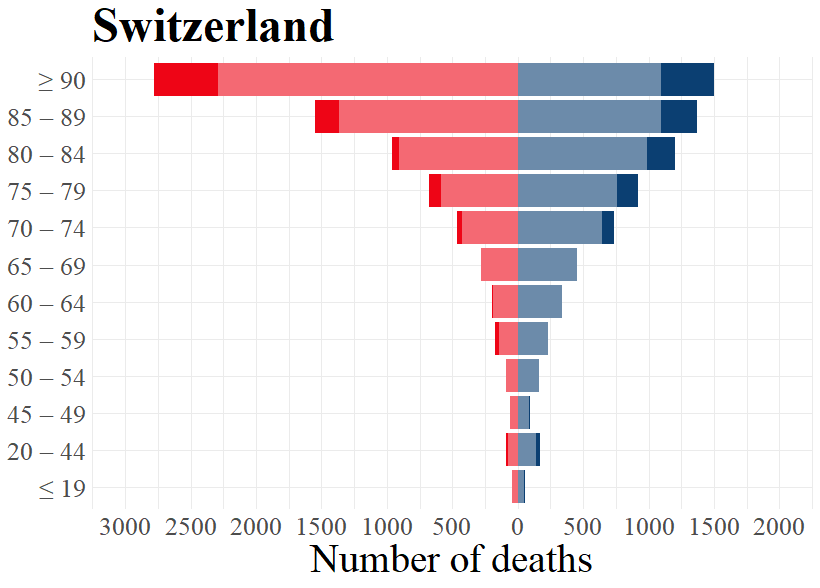
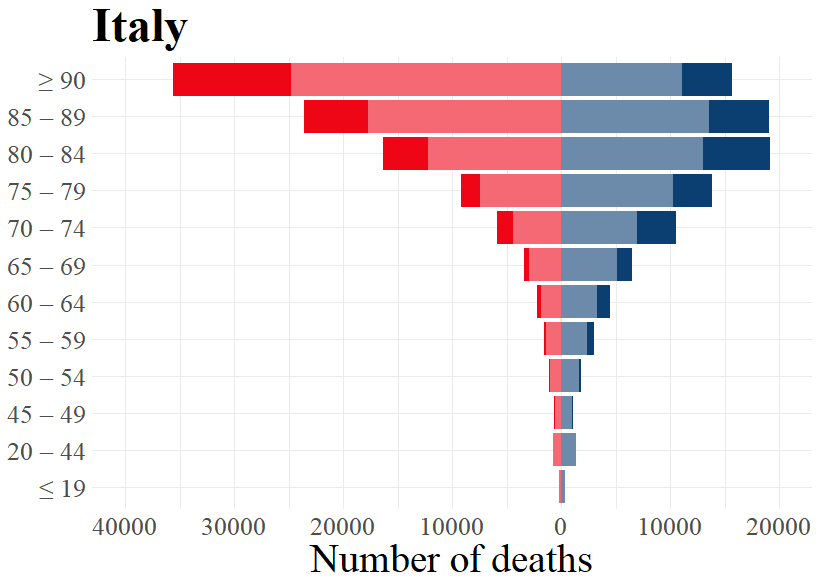
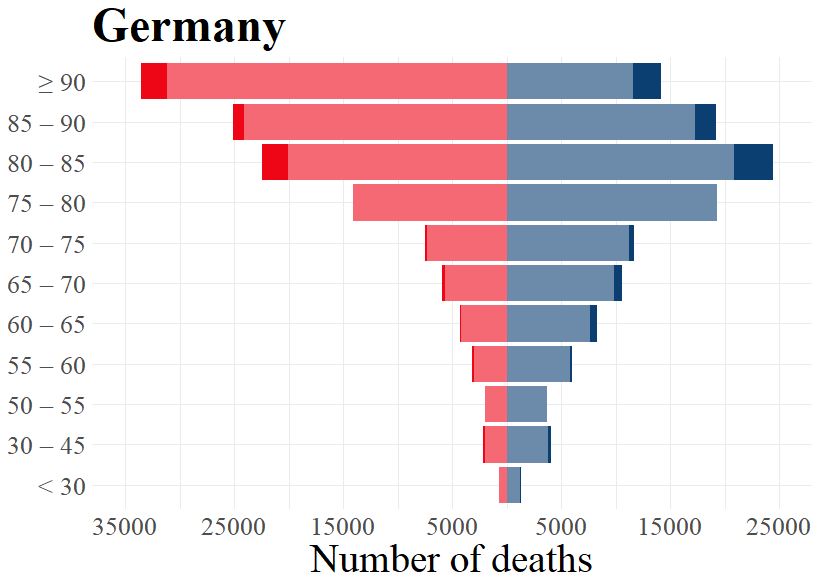

Figure 3: Expected and excess deaths per age groups for males and females by country for respective weeks.
Source: Eurostat (demo_r_mweek3) and Destatis (D_2016_2020_KW_AG)
The data for Germany is extracted from the German Statistical Office (Destatis), which differ in age grouping from the other countries based on the data by Eurostat.
Excess mortality: By regional population density
In the previous chapters, we established that there are visible differences between the different countries as concerns the number of excess deaths. This raises questions about possible explanatory factors for these differences. One often-mentioned aspect in this context is population density. Several recent studies on cities in the United States have clearly indicated that more densely inhabited places are generally more affected by COVID-19 than more rural ones.[8]
To see if we can observe a similar relationship — higher population density going along with higher excess deaths — in EU and EFTA Member States at the regional level, we focus on week 11 to week 24 in the first wave of the pandemic.[9] Furthermore, in order to account for differences in population density, we addressed the regional instead of the national level by using the Eurostat Urban-Rural Typology (NUTS 3 classification). This typology assigns one of the labels predominantly urban, intermediate, or predominantly rural to each region, based on population density data.[10] Regions that could not be classified or had missing data were excluded from further analysis.
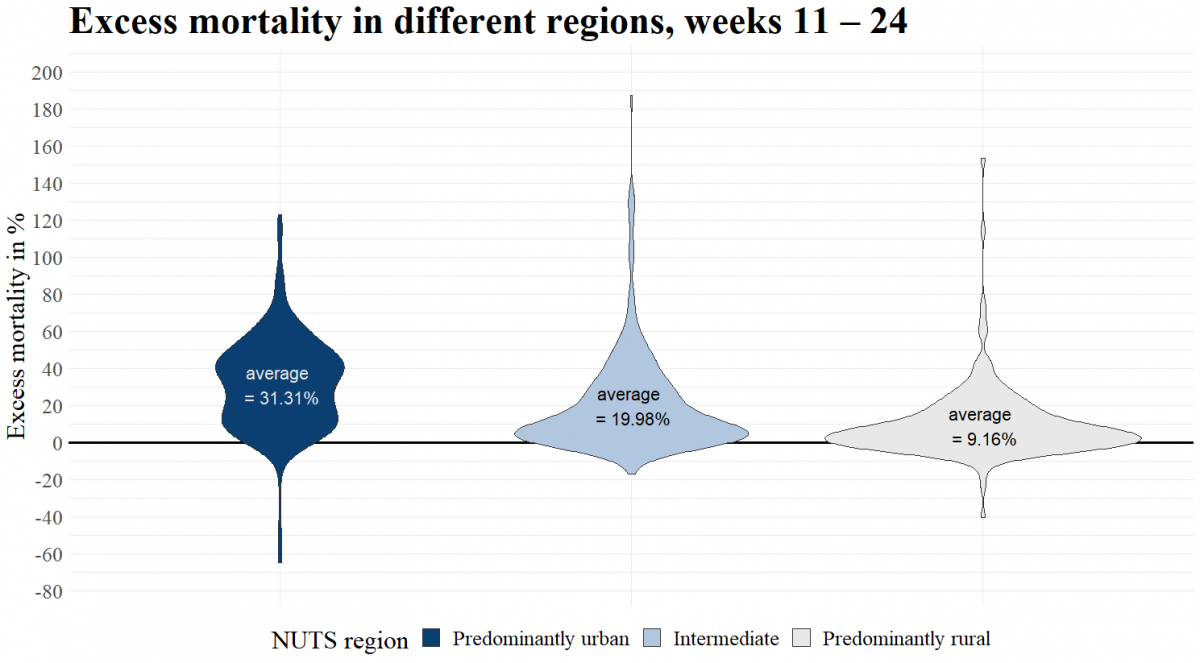
Figure 4: Excess mortality in different EU and EFTA regions, grouped at NUTS 3 level, weeks 11 – 24.
Source: Eurostat (demo_r_mweek3)
Figure 4 and Figure 5 illustrate additionally the distribution of the regions in each category according to their excess deaths. What becomes apparent in Figure 4 is that urban regions have higher mortality levels compared to the two other categories. The average excess deaths per category sees a more than 10 percent difference between rural and intermediate, and again between intermediate and urban. Higher population density is thus positively correlated with excess mortality in week 11 to week 24.
The results in Figure 4 are based on the first wave (weeks 11 – 24), when the pandemic affected Europe. Carozzi (2020) explains in a discussion paper that “population density appears to affect the impact of COVID-19 only through the timing of outbreaks and not through the rate of subsequent spread”.[11] Applied to our distinction of regional categories, we would expect that urban areas are affected first in a pandemic, “ […] but do not necessarily get hit harder” than rural regions as the time progresses.[12] To see whether a similar tendency holds for excess deaths, we compare the results shown in Figure 4 to the following time period of the same length as the first wave (14 weeks), starting in week 25.
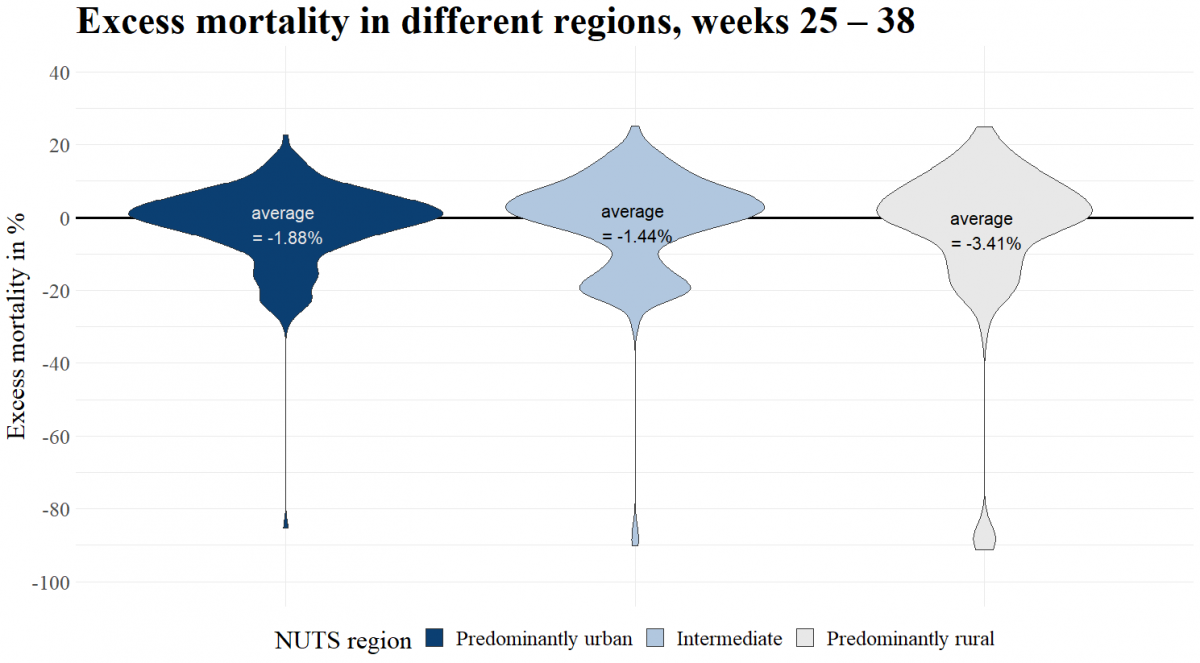
Figure 5: Excess mortality in different EU and EFTA regions, grouped at NUTS 3 level, weeks 25 – 38.
Source: Eurostat (demo_r_mweek3)
Figure 5 shows again the excess mortality among the general population of the 702 regions, but now for weeks 25 until week 38 after the first wave. Contrary to Figure 4, the conclusion that more densely populated areas are hit harder by excess mortality is not obvious anymore. The differences between the three regional categories have now almost disappeared. Noteworthy is the fact, that the average excess mortality levels of all three types of regions are now negative, i.e. on average there was a lower mortality than expected. High population density seems, thus, not to be correlated with excess mortality in week 25 to week 38 after the first wave.
In conclusion, more densely populated regions showed higher excess death rates during the peaks, but this difference had vanished in the weeks following the first wave.
[1] See for example Euronews (2020): https://www.euronews.com/2020/11/08/coronavirus-portugal-is-latest-european-country-to-issue-restrictions
[2] For Eurobase, see: https://ec.europa.eu/eurostat/de/web/COVID-19/data
For data on Germany, see also: https://www.destatis.de/DE/Themen/Gesellschaft-Umwelt/Bevoelkerung/Sterbefaelle-Lebenserwartung/Tabellen/sonderauswertung-sterbefaelle.html?nn=209016
[3] This “p-score” calculates excess mortality as the percentage difference between the number of weekly deaths in 2020 and the average number of deaths in the same week over the previous four years (2016 – 2019). A more in-depth explanation is found here: https://ourworldindata.org/excess-mortality-COVID
[4] Due to the comparatively small number of cases that lead to a distorted picture in the analysis, figures for Iceland and Liechtenstein were omitted.
[5] See for example the European Mortality Monitoring (EUROMOMO) on age: https://www.euromomo.eu/graphs-and-maps or, EU Publication DG Research and Innovation on sex:
https://op.europa.eu/en/publication-detail/-/publication/4f419ffb-a0ca-11ea-9d2d-01aa75ed71a1/language-en
[6] See, e.g. EU Report on the impact of sex and gender in the COVID-19 pandemic: https://op.europa.eu/en/publication-detail/-/publication/4f419ffb-a0ca-11ea-9d2d-01aa75ed71a1/language-en;
or the 2020 Global Health Report 50/50: https://globalhealth5050.org/2020report
[7] WHO (2020): https://www.who.int/docs/default-source/documents/social-determinants-of-health/covid19-advice-older-adults-qandas-cleared.pdf?sfvrsn=2e17964b_6
[8]Gerritse, M. (2020): https://cepr.org/file/9334/download?token=DrWFtBko
Carozzi, F. (2020): https://papers.ssrn.com/sol3/papers.cfm?abstract_id=3643204
Desmet, K., & Wacziarg, R. (2020): https://www.nber.org/papers/w27329
[9] Regional level as in NUTS 3.
[10] Definition of the Urban-Rural Typology can be found here: https://ec.europa.eu/eurostat/web/rural-development/methodology
[11] Carozzi, F. (2020, p. 4): https://papers.ssrn.com/sol3/papers.cfm?abstract_id=3643204
[12] Carozzi, F. (2020, p. 16): https://papers.ssrn.com/sol3/papers.cfm?abstract_id=3643204
|
The European Free Trade Association (EFTA) is the intergovernmental organisation of Iceland, Liechtenstein, Norway and Switzerland. EFTA's main tasks are to:
The objective of the EFTA Statistical Office in Luxembourg is to sustain and promote the participation of EFTA States in the development of an integrated Statistical System (ESS) which contributes to a European culture of evidence-based policymaking and monitoring.
|
Click here for a printer friendly version.
Authors:
Joël Henri Brunner
Fride Solheim Sigurdsson
Lars Svennebye
Volker Täube
Contact:
EFTA Statistical Office
5, Rue Alphonse Weicker
L 2920 Luxembourg
Email: EFTA-Lux [at] ec.europa.eu (EFTA-Lux[at]ec[dot]europa[dot]eu)